IDC returned again to publishing tables with revenue and units for its quarterly server tracker. As such, we are going to start covering it again. In the 1Q21 IDC Quarterly Server Tracker, we are seeing some significant moves in the market.
IDC 1Q21 Quarterly Server Tracker
First off, we generally look at revenue. Here are the revenue numbers by vendor:
| Top 5 Companies, Worldwide Server Vendor Revenue, Market Share, and Growth, First Quarter of 2021 (Revenues are in US$ Millions) | |||||
| Company | 1Q21 Revenue | 1Q21 Market Share | 1Q20 Revenue | 1Q20 Market Share | 1Q21/1Q20 Revenue Growth |
| 1. Dell Technologies | $3,556.3 | 17.0% | $3,473.7 | 18.6% | 2.4% |
| 2. HPE/H3C(a) | $3,324.9 | 15.9% | $2,891.3 | 15.5% | 15.0% |
| T3. Inspur/Inspur Power Systems(b)* | $1,507.7 | 7.2% | $1,374.5 | 7.4% | 9.7% |
| T3. Lenovo* | $1,435.4 | 6.9% | $1,063.9 | 5.7% | 34.9% |
| 4. IBM | $1,110.5 | 5.3% | $860.1 | 4.6% | 29.1% |
| ODM Direct | $5,488.7 | 26.3% | $4,826.4 | 25.9% | 13.7% |
| Rest of Market | $4,476.0 | 21.4% | $4,167.9 | 22.3% | 7.4% |
| Total | $20,899.4 | 100.0% | $18,657.7 | 100.0% | 12.0% |
| Source: IDC Worldwide Quarterly Server Tracker, June 10, 2021 | |||||
First, we see that the overall market grew revenues by 12%. As a result, we see the top 5 vendors all saw revenue growth, but there is a catch. Growth of less than 12% means that an organization is relatively losing share even if it is growing.
Here we can see a number of major trends. First, HPE did relatively well. The big gainers were really Lenovo and IBM in terms of revenue. Both had blow-out revenue figures this quarter.
Another interesting point is that ODM Direct grew slightly faster (~1.7%) faster than the rest of the market. ODM direct accounts for over 26% of the market or more than Dell plus Lenovo combined so that is a big move. The Rest of Market category saw a relative decrease in revenue attributed to it.
Dell grew by 2.4%, however in a market that is growing by 12% Y/Y, that is not an impressive figure. If we contrast this to HPE’s performance with 15% growth, HPE had revenue growth greater than the overall market, plus Dell’s revenue growth combined.
Inspur lost 0.2% revenue share, but that is a relatively small move so we consider this relatively even Y/Y. Small shifts like that can be a deal moving in or out of a quarter.
Of course, revenue only tells part of the story, we also have to look at units sold:
| Top 5 Companies, Worldwide Server Unit Shipments, Market Share, and Growth, First Quarter of 2021 | |||||
| Company | 1Q21 Unit Shipments | 1Q21 Market Share | 1Q20 Unit Shipments | 1Q20 Market Share | 1Q21/1Q20 Unit Growth |
| 1. Dell Technologies | 488,981 | 17.5% | 474,011 | 18.4% | 3.2% |
| 2. HPE/H3C(a) | 405,190 | 14.5% | 377,544 | 14.6% | 7.3% |
| 3. Inspur/Inspur Power Systems(b) | 222,596 | 8.0% | 216,896 | 8.4% | 2.6% |
| 4. Lenovo | 169,467 | 6.1% | 154,415 | 6.0% | 9.7% |
| T5. Super Micro* | 128,558 | 4.6% | 131,989 | 5.1% | -2.6% |
| T5. Huawei* | 116,606 | 4.2% | 100,035 | 3.9% | 16.6% |
| ODM Direct | 887,520 | 31.7% | 770,466 | 29.8% | 15.2% |
| Rest of Market | 377,236 | 13.5% | 356,689 | 13.8% | 5.8% |
| Total | 2,796,154 | 100.0% | 2,582,044 | 100.0% | 8.3% |
| Source: IDC Worldwide Quarterly Server Tracker, June 10, 2021 | |||||
Revenue is a different picture on a number of different fronts.
Dell managed to grow shipments by 3.2% but with only 2.4% revenue growth that points to declining share with lower ASPs that we will see in our ASP section.
HPE saw revenue grow at a rate of around twice its unit volume growth rate which means that its ASPs are going up.
Inspur saw its units grow at a smaller pace than revenue, so its ASPs are also increasing, like HPE’s.

Lenovo had a large ASP spike moving from well below average to well above average.
We also see that the ODM Direct segment grew at a rate higher than the other players. Something we should quickly point out here is that ODM Direct we would expect to have lower attach rates of non-hardware items that we typically see on Dell and HPE. That is a key driver as to why ODM Direct ASPs are significantly lower than Dell, HPE, and Lenovo.
Annual Server ASP Movement
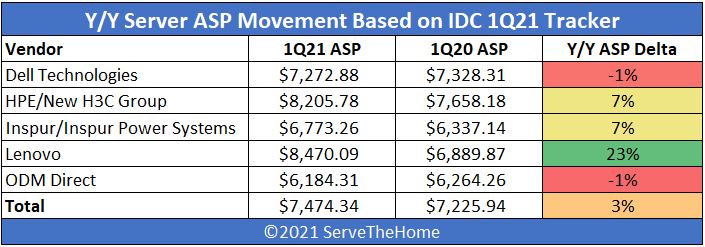
When we look at year/ year average selling price (ASP) performance, we can see some big moves:

We are rounding to whole percentages, but the total Y/Y ASP delta is 3.44%. Many companies are discussing chip shortages, component price increase, and overall market inflation. This increase in server ASPs seems more in line with general market inflationary trends versus some major shift. We will see what happens in Q2, and particularly the Q3 numbers as the Ice Lake Intel Xeon generation started to ship in higher quantities later in Q2 with more SKUs becoming available. We just did a video on the new SKU naming conventions.
Dell and ODM direct were the two major buckets that saw ASPs decline. HPE, Inspur, and Lenovo all saw ASPs increase in Q1 Y/Y.
We are not going to have our quarterly ASP movement numbers because IDC did not publish figures in the last edition.
Looking at “The Trend”
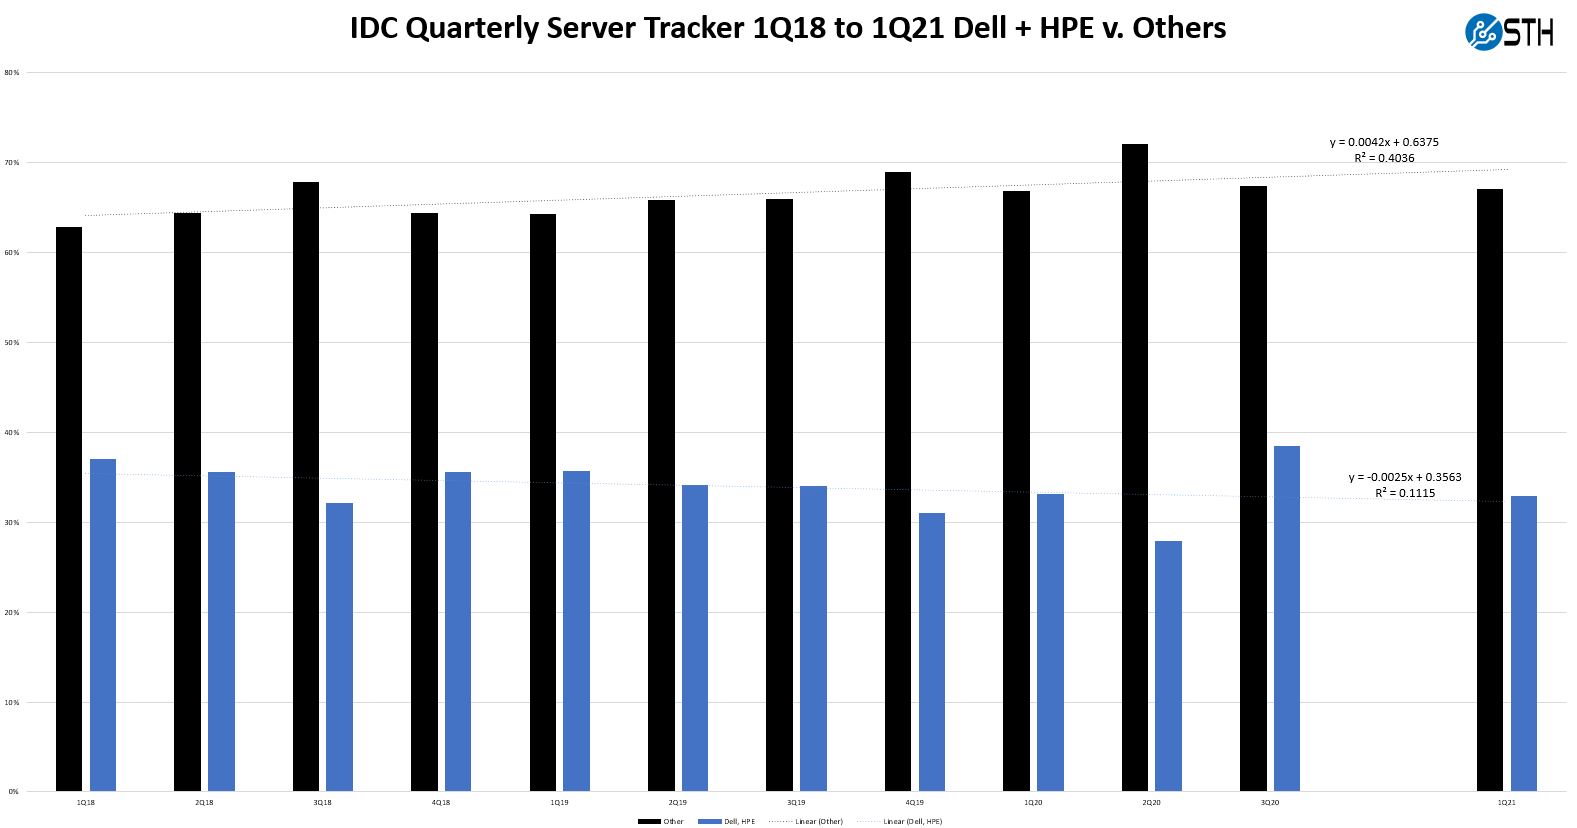
Dell and HPE have dominated the server market for years. Other vendors have been slowly chipping away at the market here is what that trend looks like based on IDC’s data (minus the last quarter where IDC did not provide the data:

Something we should note is that Dell and HPE have about 1% more revenue share than unit shipment share due to higher ASPs. Still, we see a trendline that is clearly sloping away from Dell and HPE over time. Given that IDC pegged 1Q21 server revenue at around $20.9B USD, a 1% revenue shift from Dell and HPE to other vendors now represents $200M+. In 1Q21 it appears as though Dell and HPE did better than the overall trend, but largely due to HPE’s performance.
Final Words
Overall, there have been some big moves over the past few months as the global pandemic has slowed in many countries and companies are dealing with chip shortages and inflation. This week, the US Labor Department said that consumer prices raised by 5% in May 2021. Against that level of inflation, server vendors will need to see 5% or greater revenue growth which all of the top 5 server vendors other than Dell managed to achieve.
As always, check out the 1Q21 IDC Quarterly Server Tracker for more information. IDC has services to get into more detail each quarter, but we are just using the publicly available data.


IBM is 4th? Not bad IMHO, but since IBM left PC/x86/amd64 server business a long time ago (sold to Lenovo), this means the revenue consist solely of POWER and z systems sales. Since POWER is basically at the end of POWER9 life-cycle and is waiting for renewal with POWER10, then majority if not all of this grow is coming from “good old” mainframe business. And that is interesting.
The global supplier pinch is about to hit the server makers this fall. The “trusted” manufacturers are having a hard time finding alternate sources of certain components. This usually translates into 2 things, shipping delays (like in autos) or price hikes to cover new supplier startup costs.
Not surprised. Lenovo was very competitive on a recent project of ours. Cheaper than Supermicro with much better support contracts.
Dell wouldn’t meet the Lenovo quote.
Patrick: oh, that sounds awful. So west countries basically ban Huawei and got P.R.C. out of the door and it just starts to creep into the window again this time with Lenovo. I guess all Lenovo server gears is also made purely in P.R.C. and whatever is done there is way beyond any (security) analysis of 99% of businesses.
BTW: I see this trend also in laptops, lenovos are usually a bit cheaper and bit better than competition. Not talking about thinkpads here, but about other lenovos